U.S. vs. China Manufacturing Comparison
U.S. Manufacturing Output
$2.4T
2023
China Manufacturing Output
$4.5T
2023
U.S. Average Hourly Labor Cost
$32/hour
2023
China Average Hourly Labor Cost
$5/hour
2023
U.S. Robotics Density
350 robots/10k workers
2023
China Robotics Density
150 robots/10k workers
2023
U.S. Export Share
12%
Global Manufacturing
China Export Share
28%
Global Manufacturing
Detailed Comparison Table
| Metric | United States | China |
|---|---|---|
| Manufacturing Output (US$ trillions) | 2.4 | 4.5 |
| Average Hourly Labor Cost | $32 | $5 |
| Robotics Density (robots per 10,000 workers) | 350 | 150 |
| Export Share of Global Manufacturing | 12% | 28% |
| Number of Manufacturing Jobs | 12.1 million | 21.5 million |
Key Insights
- The U.S. leads in automation and productivity but lags in sheer volume and labor costs
- China dominates global manufacturing output and export share
- Higher U.S. wages make offshoring financially attractive for many companies
- Automation is shifting job requirements toward higher-skilled positions
Key Takeaways
- The shift from domestic factories to overseas production began in the 1970s and accelerated with global trade agreements.
- Automation and robotics cut labor demand, while higher wages pushed firms to seek cheaper workforces abroad.
- Policy choices-trade liberalization, tax incentives for offshore investment, and weak industrial policy-shaped the trajectory.
- The Rust Belt’s decline illustrates the social cost of losing manufacturing jobs.
- Recent reshoring attempts face higher costs, but new technology and supply‑chain risks are reviving interest.
When people talk about the American manufacturing decline, they’re really asking why an economy that once built cars, steel bridges, and household appliances now imports a large share of those same goods. The answer lies at the intersection of economics, technology, and public policy, each pulling the sector in a different direction.
American manufacturing is a sector that produced goods ranging from automobiles to steel, once employing millions of workers across the United States. In 1950 the manufacturing share of U.S. GDP peaked at 30%, and the industry accounted for roughly 20% of total employment. By 2023 that share had slipped below 12% and jobs had fallen to under 12million, a fraction of the post‑war high.
1. Globalization - Opening the Door to Offshore Production
Trade liberalization in the late 20thcentury removed many barriers that once protected U.S. factories. The 1979-1982 phase‑in of the General Agreement on Tariffs and Trade (GATT) set the stage for lower import duties on industrial goods. When the North American Free Trade Agreement (NAFTA) signed in 1994 eliminated most tariffs between the United States, Canada, and Mexico, manufacturers found it cheaper to ship components across the border and assemble them where labor cost was lower.
China’s entry into the World Trade Organization in 2001 was the next catalyst. Its massive labor pool-average wages under $5hour in the early 2000s-made it the world’s factory floor. U.S. firms such as apparel companies and electronics assemblers moved production to Chinese plants, re‑routing supply chains that previously ran through Detroit or the Ohio Valley.
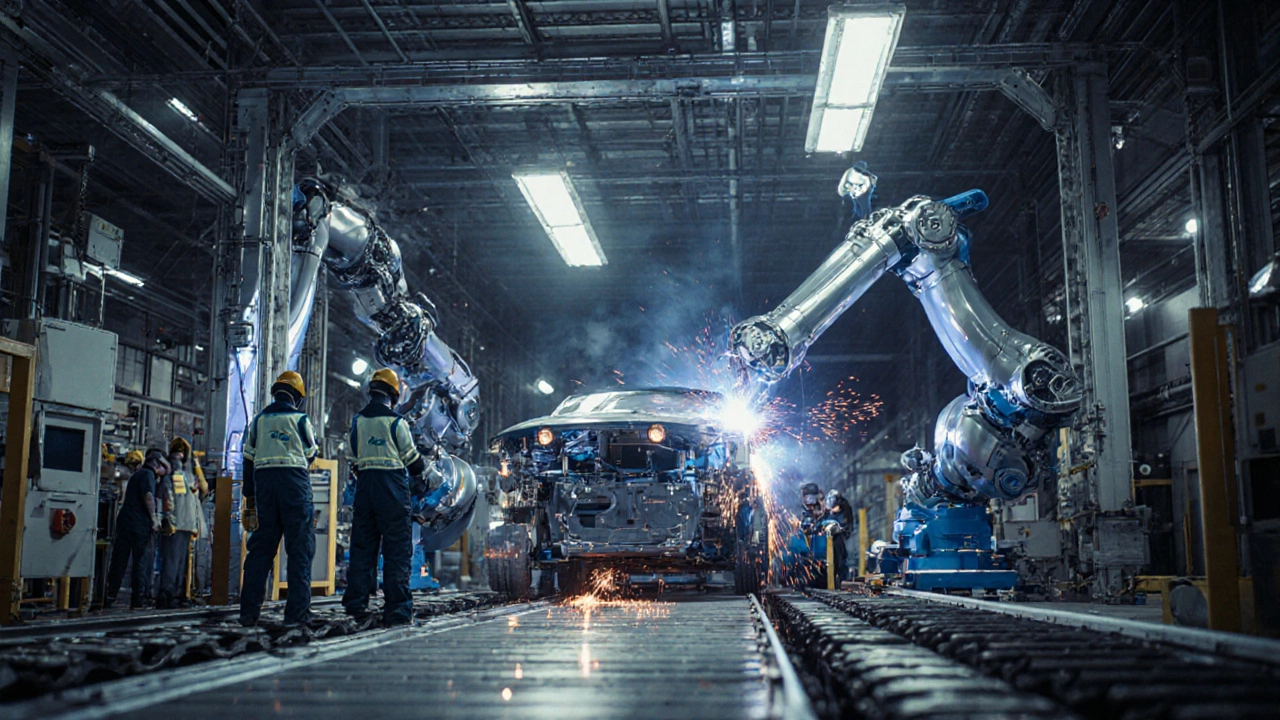
2. Automation - Machines Replacing Hands
While offshoring cut the number of low‑skill jobs, automation reduced the need for many remaining domestic roles. The adoption of robotics in automotive plants started in the 1980s, but the pace accelerated after the turn of the millennium. By 2020, a typical car factory used an average of 85% robots for welding and painting, compared with 40% in 1995.
Advanced manufacturing technologies-computer‑numerical‑control (CNC) machines, 3‑D printing, and AI‑driven quality control-have boosted productivity dramatically. The Bureau of Labor Statistics reports that output per hour in U.S. manufacturing rose from 119 units in 1980 to 310 units in 2022, yet employment fell by roughly 30% during that span.
3. Labor Costs and Union Decline
U.S. workers have seen real wage growth outpace many developing economies since the 1990s. A 2023 study by the Economic Policy Institute found that average manufacturing wages grew 2.1% annually, while comparable wages in Vietnam rose only 1.2%. Higher labor costs made offshore alternatives more attractive.
At the same time, union membership among manufacturing workers dropped from 38% in 1970 to 13% in 2022. Weaker collective bargaining reduced wage pressure on the industry but also eroded political clout that could have supported industrial policy or retraining programs.
4. Policy Choices - Favoring Flexibility Over Industrial Strategy
U.S. trade policy has largely emphasized market openness rather than protecting strategic sectors. The 1985 U.S.-Japan Textile Agreement and subsequent textile‑carrying agreements opened the market to cheaper Asian fabrics, further squeezing domestic textile mills.
Tax incentives also nudged firms abroad. The 1993 International Tax Reform allowed multinational corporations to shift profits to low‑tax jurisdictions, effectively subsidizing the relocation of production facilities.
Meanwhile, few federal programs targeted revitalizing the manufacturing base directly. The Manufacturing Extension Partnership (MEP), a small‑scale advisory network, helped only a fraction of firms, while large‑scale stimulus efforts focused on infrastructure rather than factory modernization.

5. The Rust Belt - A Human Story
The term “RustBelt” emerged in the 1980s to describe the belt of states from Pennsylvania through Ohio, Indiana, Michigan, and Illinois that suffered massive plant closures. In 1975, the steel city of Youngstown, Ohio, boasted 70% employment in steel mills. By 1990, that figure had plummeted to under 10%.
Social impacts were profound: unemployment spikes, population loss, and a rise in opioid addiction. A 2021 University of Michigan study linked the influx of opioid prescriptions directly to regions with sharp manufacturing job declines, underscoring the health fallout of deindustrialization.
6. Recent Reshoring Trends - Can the Tide Turn?
Supply‑chain disruptions caused by the COVID‑19 pandemic and the 2022‑2023 geopolitical tensions (e.g., the Russia‑Ukraine war) revived interest in domestic production. The Reshoring Initiative reported a 12% increase in U.S. manufacturers moving parts of their supply chain back home between 2020 and 2023.
However, reshoring faces steep cost barriers. Labor rates are now roughly three times higher than in low‑cost Asian hubs, and the capital outlay for new equipment remains significant. Companies that succeed often pair reshoring with advanced automation, creating “smart factories” that offset higher wages with productivity gains.

7. Comparison: United States vs. China Manufacturing Landscape (2023)
| Metric | United States | China |
|---|---|---|
| Manufacturing Output (US$ trillions) | 2.4 | 4.5 |
| Average Hourly Labor Cost | $32 | $5 |
| Robotics Density (robots per 10,000 workers) | 350 | 150 |
| Export Share of Global Manufacturing | 12% | 28% |
| Number of Manufacturing Jobs | 12.1million | 21.5million |
The table shows that while the United States leads in automation and wages, China dominates sheer volume and export share. Those differences explain why many U.S. firms still find overseas production financially attractive.
8. Lessons for Policymakers and Business Leaders
- Invest in workforce upskilling: Automation will keep rising; a skilled labor pool can command higher‑value jobs within the sector.
- Targeted tax credits for R&D and capital equipment can make domestic factories more competitive.
- Encourage cluster development-linking manufacturers with local universities and research centers-mirroring the Silicon Valley model for tech.
- Balance trade openness with strategic safeguards for critical industries such as semiconductors and advanced materials.
By aligning policy with the realities of a tech‑driven global economy, the United States can retain a vibrant manufacturing base, even if its shape differs from the mid‑20thcentury model.
Frequently Asked Questions
Why did U.S. manufacturing employment fall so sharply after the 1970s?
A combination of offshoring driven by lower labor costs abroad, rapid automation that reduced labor intensity, and policy decisions that emphasized trade liberalization over protective industrial measures led to a steep decline in domestic manufacturing jobs.
How did trade agreements like NAFTA affect American factories?
NAFTA removed most tariffs among the U.S., Canada, and Mexico, allowing companies to relocate production to lower‑cost Mexican plants while still accessing the North American market, accelerating the loss of many mid‑skill manufacturing jobs in the United States.
Is reshoring a realistic solution for the U.S. economy?
Reshoring can be part of a broader strategy, especially for high‑value, tech‑intensive products where supply‑chain risk outweighs labor cost differences. However, it requires substantial investment in automation and workforce training to be economically viable.
What role did the decline of unions play in the manufacturing drop?
Union membership fell dramatically, reducing collective bargaining power for workers. This weakened the political push for protective industrial policies and made it easier for firms to move operations abroad without facing strong domestic resistance.
How does automation affect the quality of remaining manufacturing jobs?
Automation tends to shift demand toward higher‑skill positions such as programming, equipment maintenance, and data analysis. While the total number of jobs declines, those that remain often pay better and require more technical expertise.